
Watertown Budget & Tax — Visual Breakdown
A Watertown Post Analysis | Watertown, NY 13601
The Bottom Line
Over the past 12 months, Watertown has experienced one of its most contentious budget cycles in recent memory.
What began as a proposed 18.8% property tax increase during spring 2025 negotiations ultimately resulted in:
- Adopted Property Tax Rate (FY 2025–26): $10.2700 per $1,000 assessed value
- Increase: +$0.8624 per $1,000
- Rate Increase Percentage: 9.17%
- Property Tax Levy: $11,518,551
- Levy Increase: $875,479 (+8.23%)
The debate required a New York State tax cap override, which initially failed — then passed later the same night — reopening the door for a levy above the state cap.
Officials framed the issue around pension pressures, personnel costs, and declining assessed values. Critics framed it very differently.
Let’s break down the math.
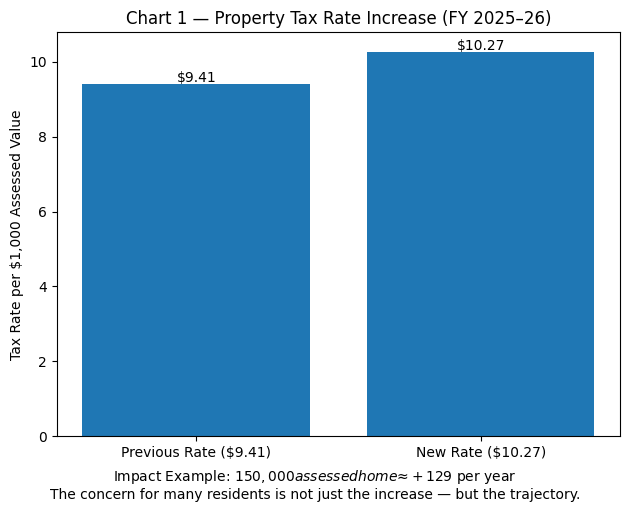
📊 Chart 1 — Property Tax Rate Increase
Previous Rate (Approx.): $9.4076
New Rate: $10.2700
That’s roughly $129 more per year on a $150,000 assessed home.
For many residents, the issue isn’t just the increase — it’s the trajectory.
📈 Chart 2 — Levy Growth
Prior Levy: ~$10.64M
New Levy: $11.52M
Officials argue the levy increase reflects structural pressures — not spending sprees.
What Drove the Increase?
According to audited financial documents presented in February 2026:
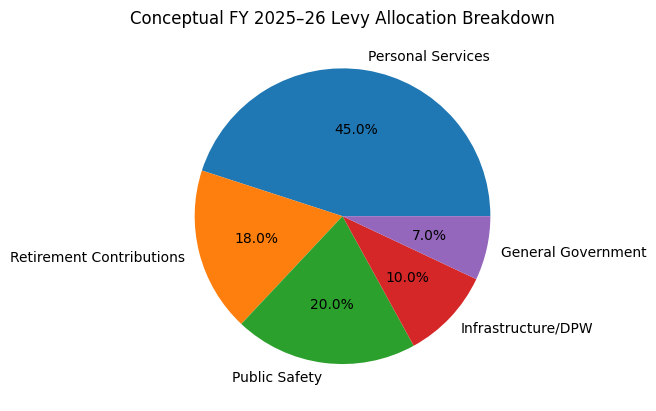
Major Pressures Identified:
- Higher retirement system contribution rates
- Growth in personal services
- Slight decline in assessed taxable value
- Continued use of fund balance
- Water & sewer increases (3% each)
Officials warned early that FY 2026–27 may be more difficult, with preliminary projections around $63.6 million, roughly $5 million above the prior year.
One council member publicly warned that even extremely large tax increases may not keep pace with trend lines.
The Tax Cap Override Drama
On May 19, 2025:
- The override initially failed
- It was reconsidered
- It passed later that same night
That moment allowed the City to legally exceed the NY property tax cap.
Without that override, severe cuts would likely have been required.
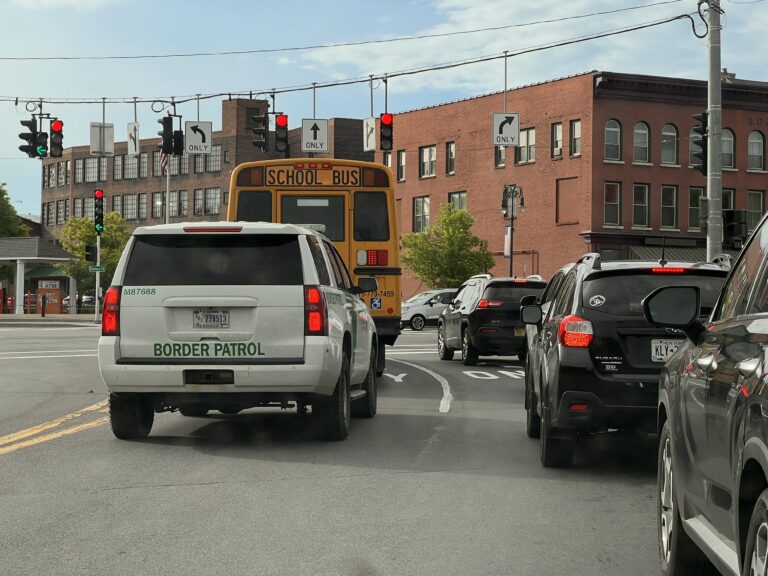
🚔 The Take-Home Vehicle Question
A document publicly circulated listing “Response Vehicles” shows police department roles associated with assigned or shared response vehicles, including K9 units and after-hours shared vehicles.
What we do NOT yet have in documented form:
- A citywide take-home vehicle policy
- Total number across all departments
- Mileage logs
- Annual incremental commuting cost
So let’s do conservative math.
Estimated Annual Commuting Cost Scenarios
Assumptions (illustrative only):
- 10–14 take-home vehicles
- 20–40 commute miles per day
- 230 workdays
- $0.30–$0.60 per mile cost
Estimated Annual Range:
$13,800 to $77,300
Even using high assumptions, this remains in the tens of thousands — not millions.
That does not make the issue irrelevant. It does mean it likely is not the primary driver of multi-million dollar budget growth.
Transparency matters. But scale matters too.
Reconciling the $7.54 vs. $10.27 Confusion
Some reporting lists Watertown’s tax rate at $7.54 per $1,000.
The City’s adopted rate is $10.2700 per $1,000 assessed value.
The likely explanation: equalization rate differences when comparing municipalities statewide.
These are different calculation contexts — not necessarily conflicting numbers.
Political Framing vs Financial Documentation
In official minutes and regional reporting, the debate centers on:
- Pension obligations
- Personnel costs
- Service levels
- Tax base constraints
Ideological labels appear more frequently in social media than in official documents.
Budget math, however, is not ideological. It is arithmetic.
What Comes Next?
Early FY 2026–27 signals suggest:
- Continued pension pressure
- Potential job cuts
- Difficult levy discussions
- Calls for earlier public engagement
Residents now face a real question:
Do we reduce services? Increase taxes further? Or restructure operations?
That is the policy crossroads.
Verification & Transparency Next Steps
For full clarity on fleet and budget drivers, the following would provide definitive answers:
- Formal fleet take-home eligibility policy
- Authorized vehicle roster by department
- Fuel card summaries & mileage logs
- Final FY 2026–27 proposed budget packet
Those records would allow taxpayers to move from rumor to documentation.
And There We Have It
Watertown’s tax increase over the past 12 months is real.
It is measurable.
It is documented.
The primary drivers appear structural — particularly retirement contributions and personnel costs — not one-off discretionary programs.
The take-home vehicle issue, while politically potent, appears modest in scale unless further documentation shows otherwise.
As FY 2026–27 approaches, the conversation is likely to intensify.
This time, the math will matter even more.